Last Updated June 26th, 2023
Climate change is causing increasing impacts on natural and human systems worldwide. In Maine, we are seeing warmer temperatures, diminished winters, summer weather extending into the fall, increasing annual precipitation in conjunction with a shift towards more extremes, rising sea level along the coast, and warming waters in the Gulf of Maine. These changes in turn affect both terrestrial and marine ecosystems and environments, and carry profound adaptation and management challenges for agriculture, forestry, fisheries, aquaculture, outdoor tourism, as well as human, animal, and ecosystem health.
The purpose of this document is to provide a summary of key aspects of Maine’s changing climate that can be used by educators and students. The material is drawn largely from the Maine’s Climate Future report series (2009, 2015, and 2020) led by the University of Maine, and from the Scientific Assessment of Climate Change and Its Impacts in Maine report (2020) compiled by the Scientific and Technical Subcommittee of the Maine Climate Council. This is meant to be a "living" document that will be updated as new information becomes available. Moreover, links to data accessible from the Maine Climate Office website are provided for further exploration.
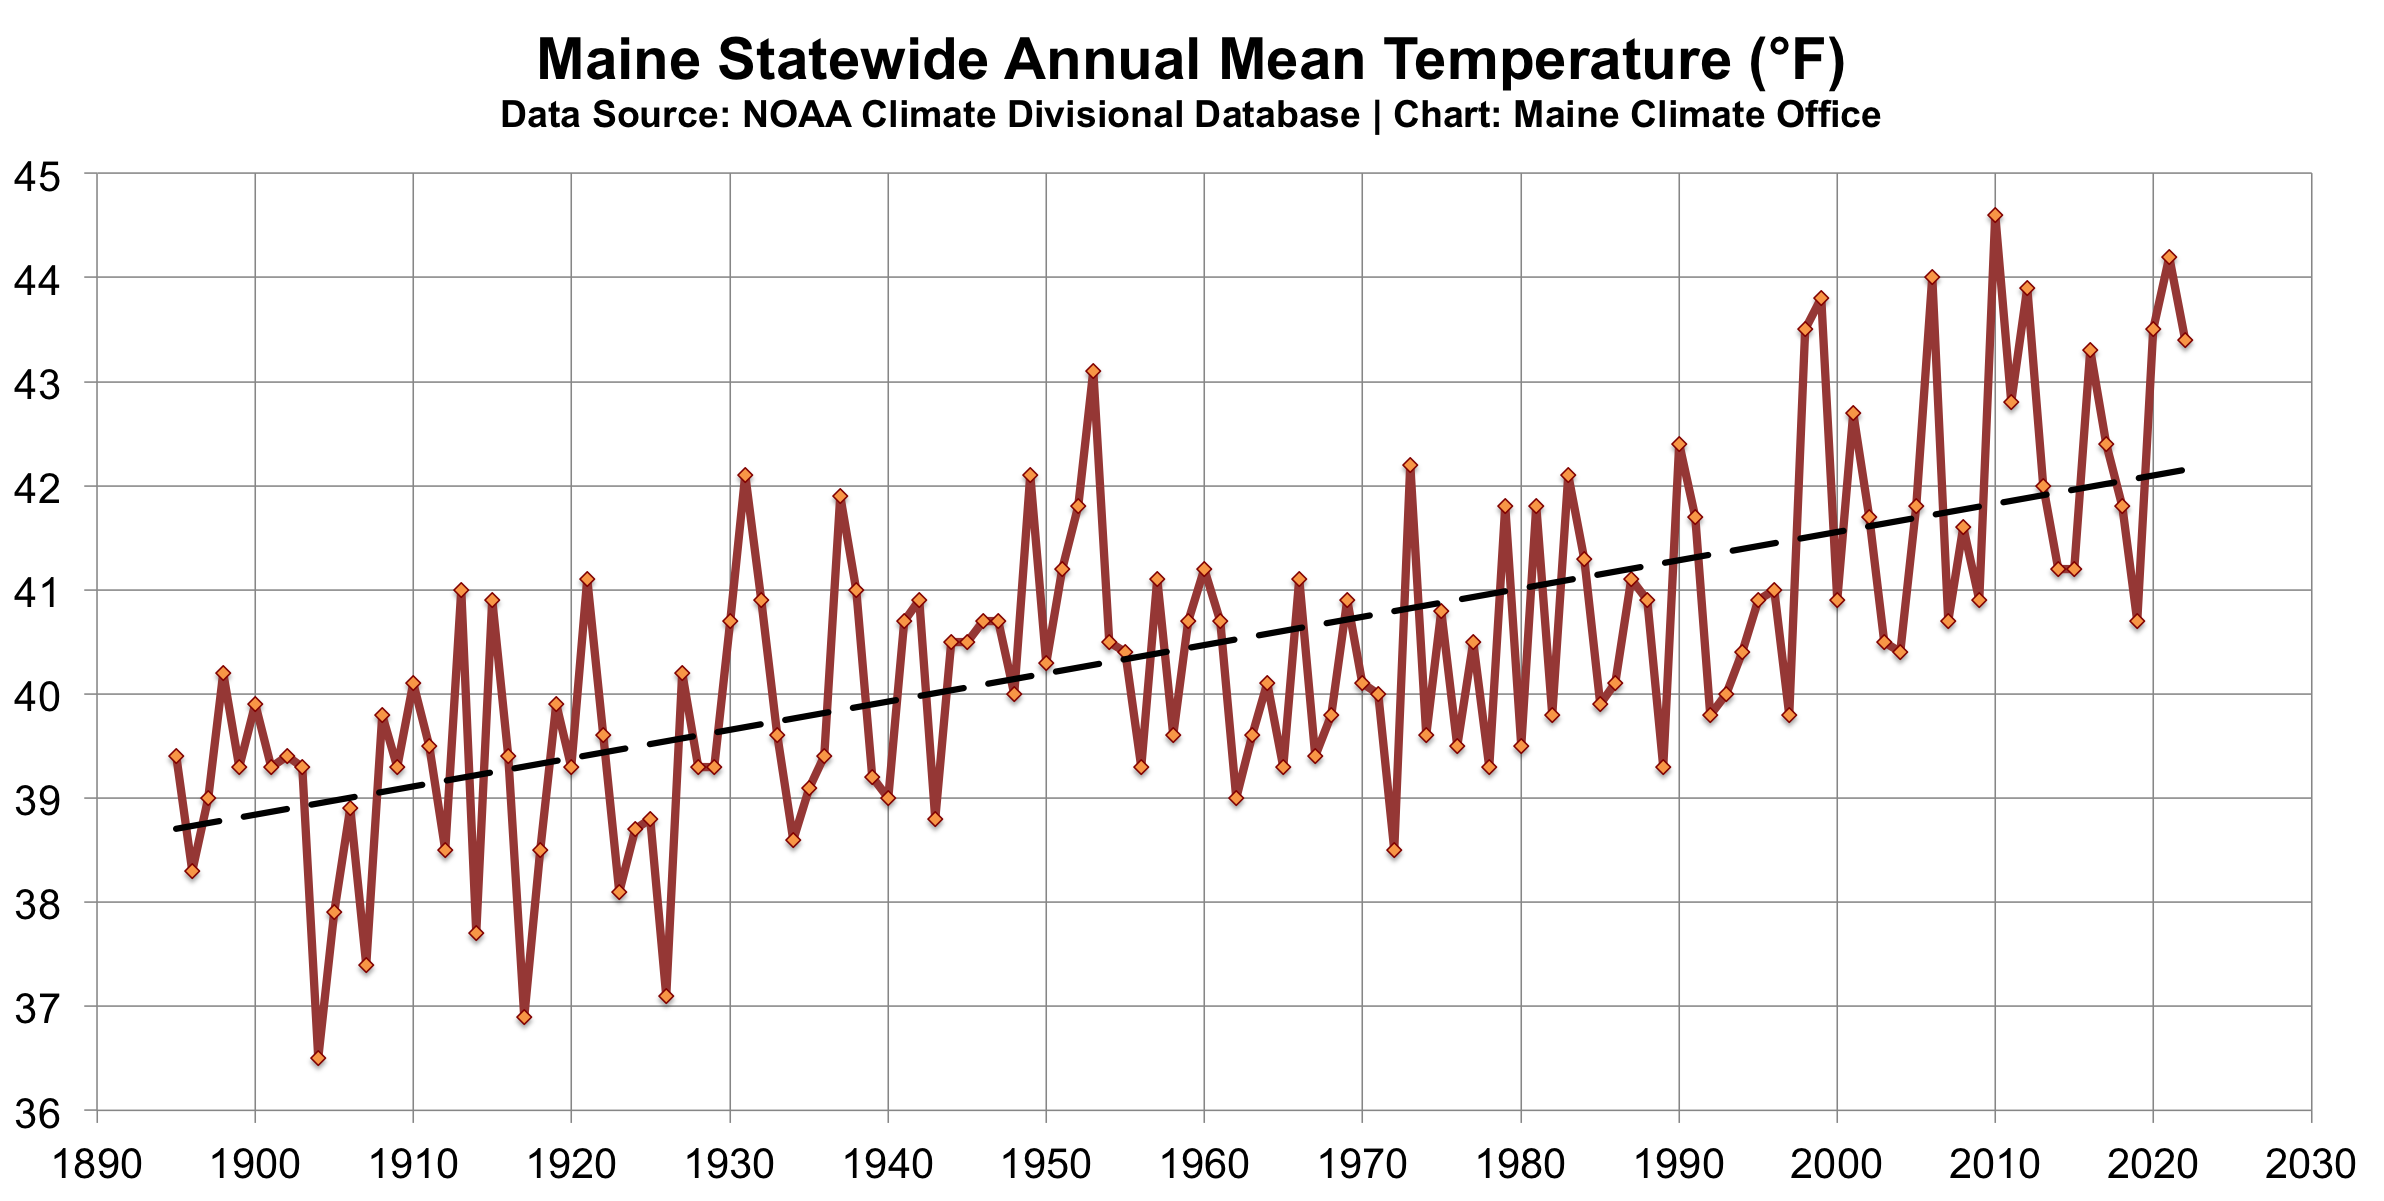
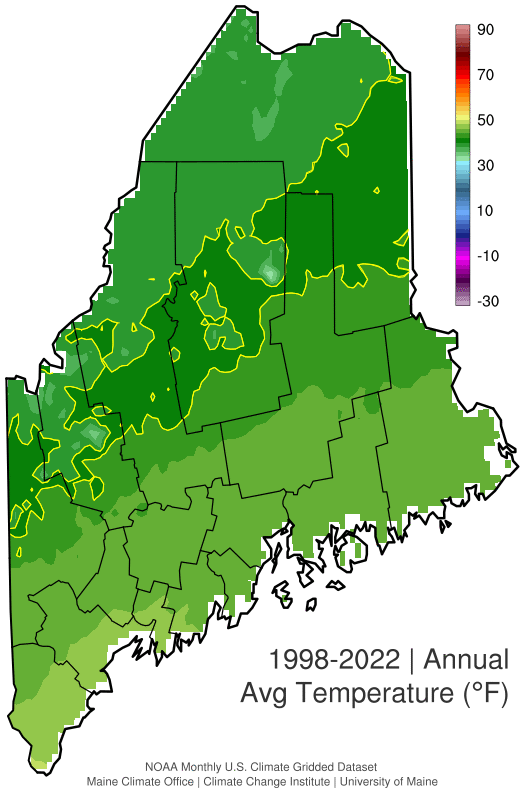
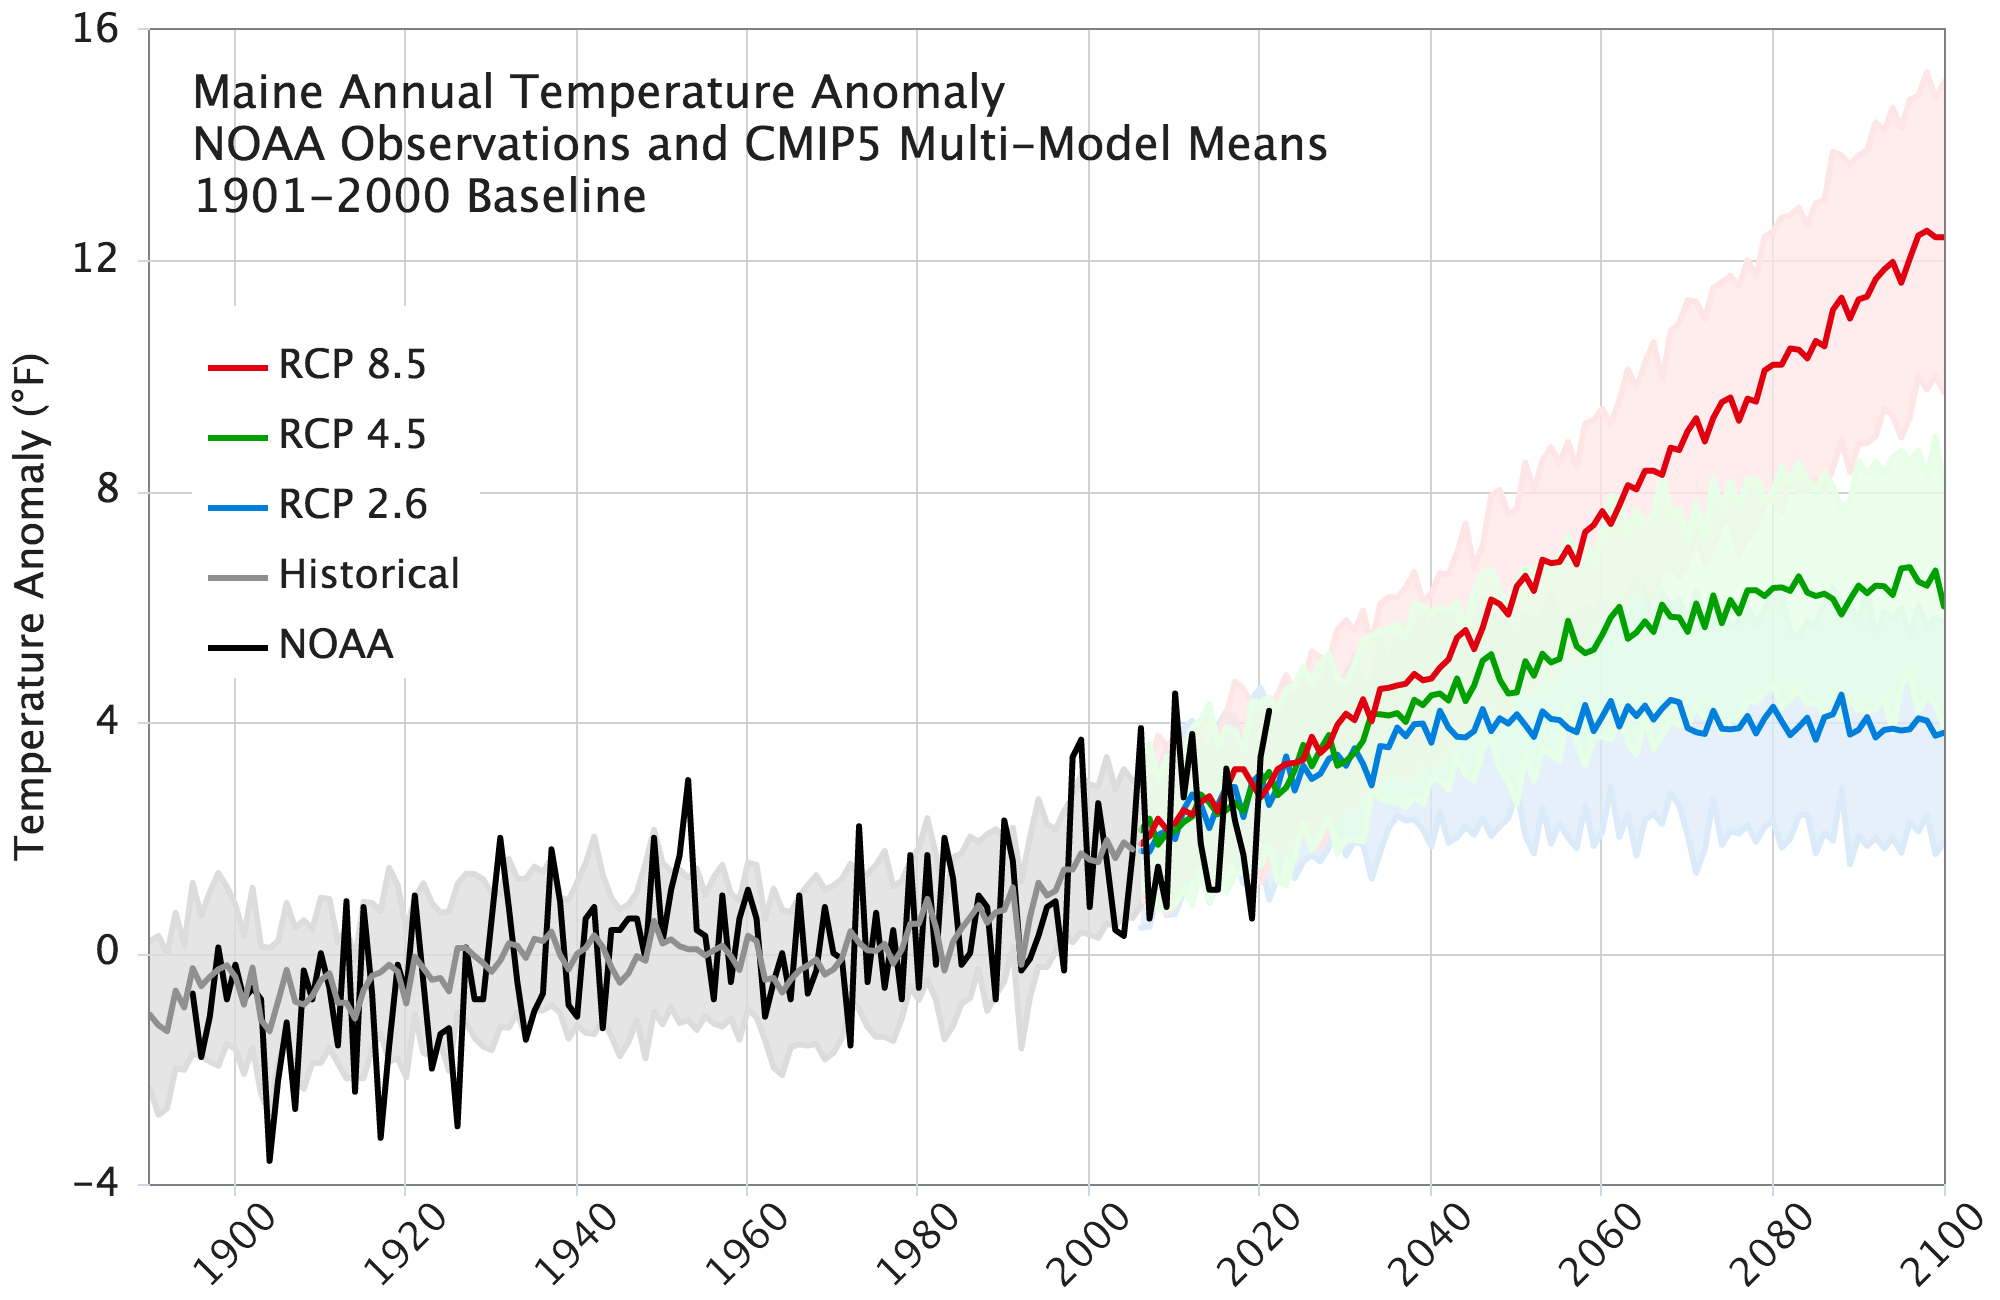
Over the past century, Maine’s statewide mean annual temperature has increased by about 3°F (MCC 2020), and the eight warmest years have all occurred since 1998 (Fig. 1). This warming is associated with seasonal climate shifts. For example, since the early 1900s, the average duration of winter in terms of temperature and snow cover has declined by about 2 weeks, while the relative length of summer has increased (Birkel and Mayewski 2018; Fernandez et al. 2015). A similar trend is found in the growing season, where an analysis of first and last frost dates based on daily minimum temperatures for sites across Maine found an average increase of 16 days since 1950 (Fernandez et al. 2020). Most of the additional growing season days are due to warmer temperatures in late summer/early fall, especially since the late 1990s. Climate model projections indicate that Maine’s mean annual climate could warm 2–4°F by 2050 and up to 10°F by 2100 depending on future greenhouse gas emissions worldwide (Fig. 2). With this warming, the number of summer days with high heat index (e.g., > 95°F) are also expected to at least double by mid century (Fernandez et al. 2015).
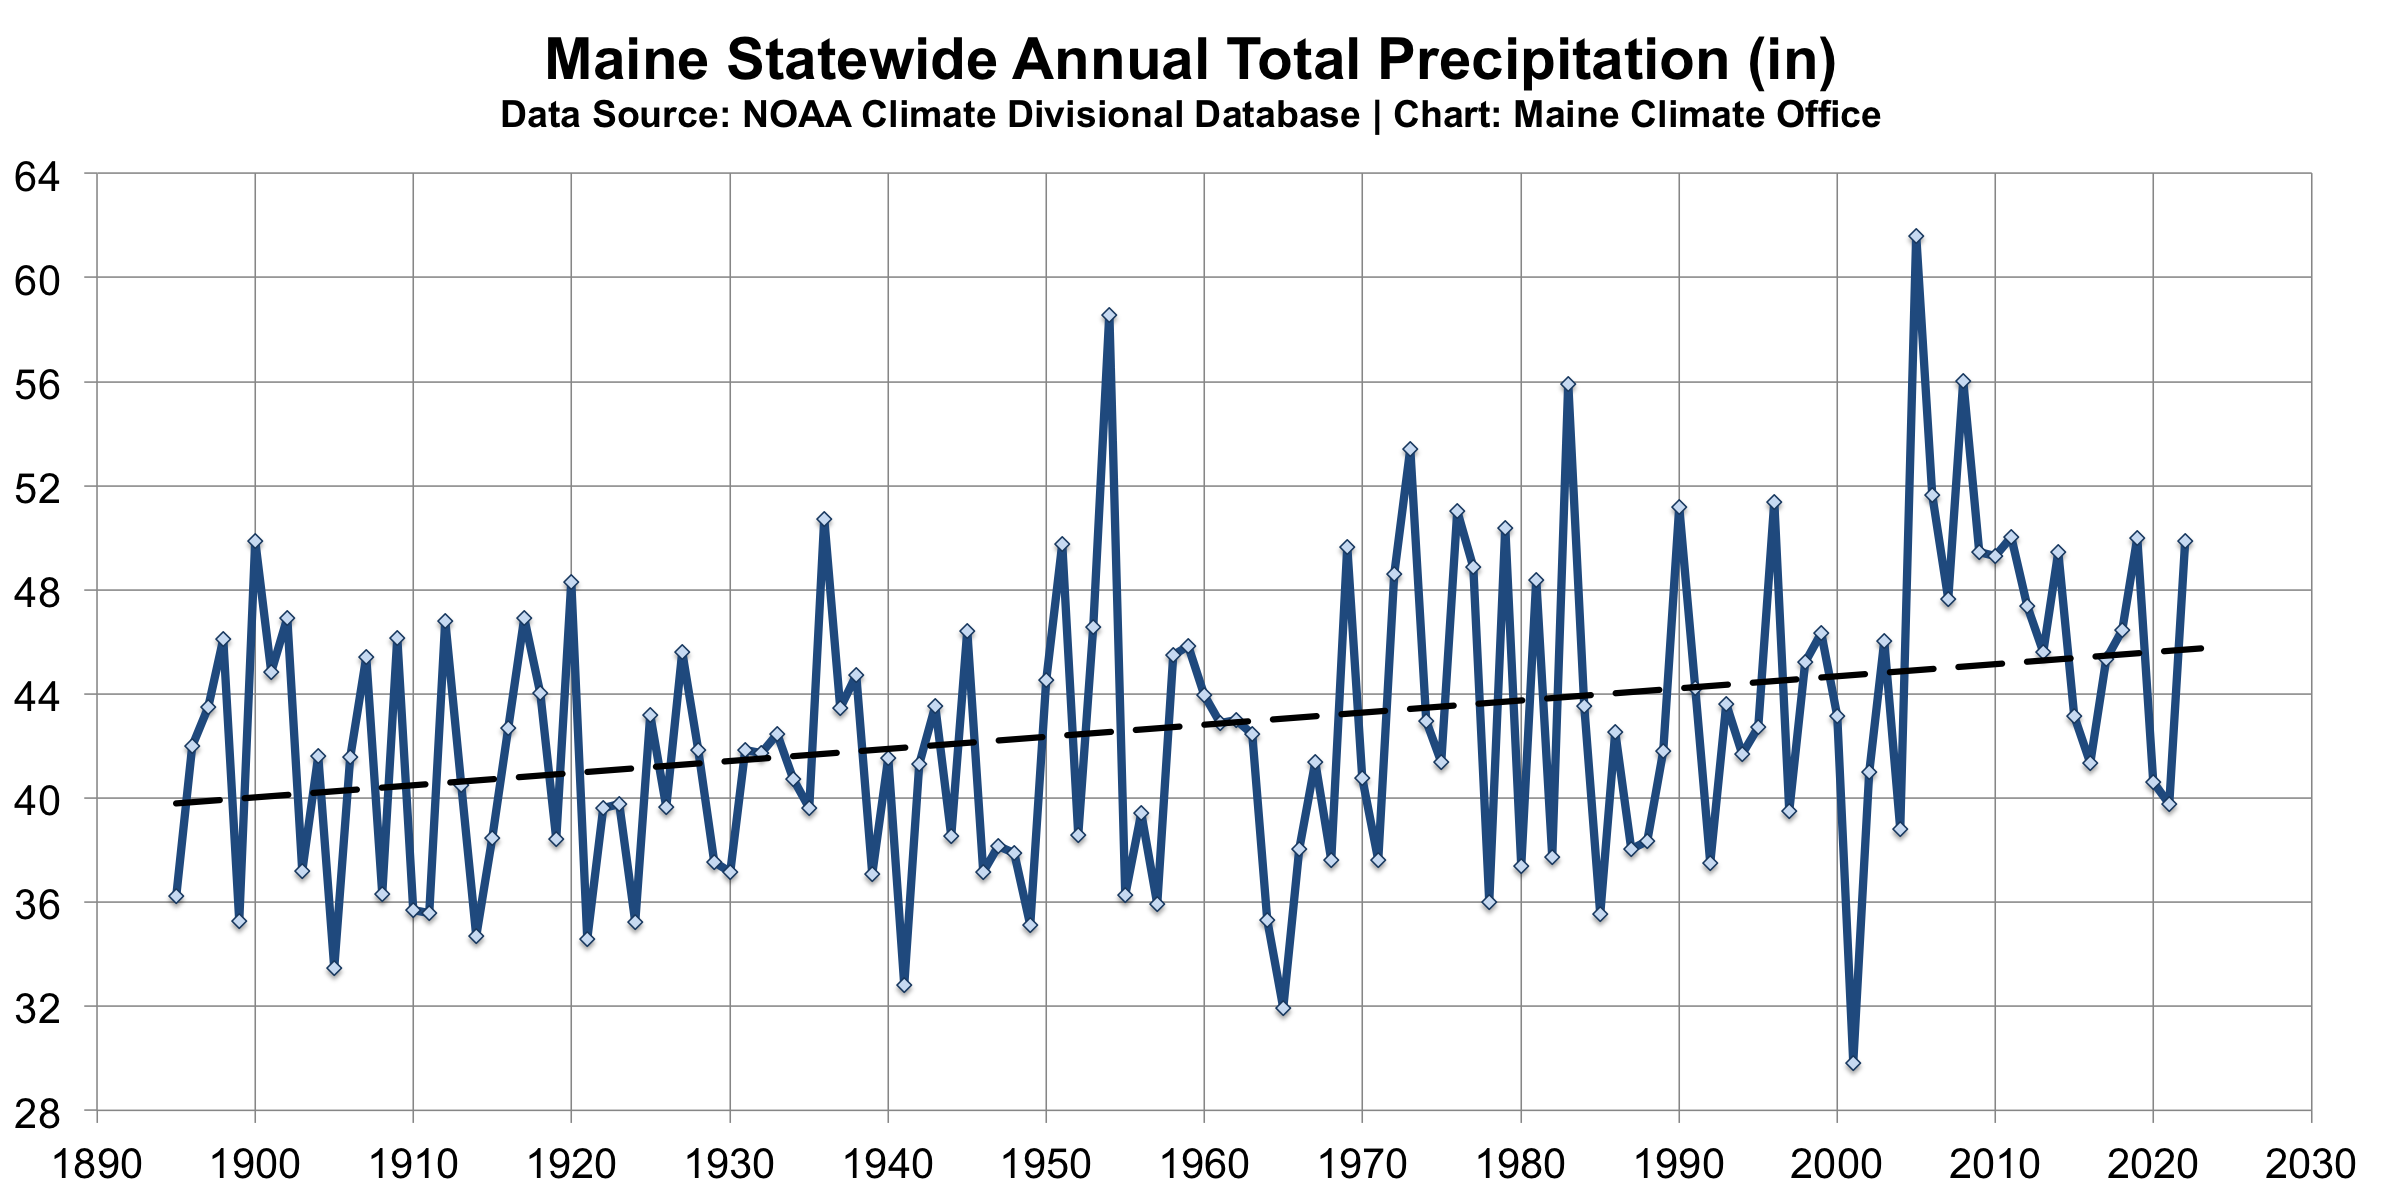
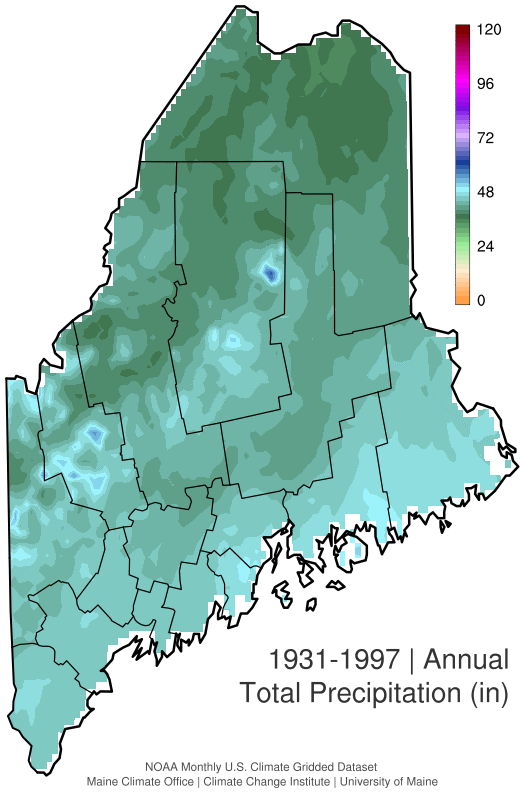
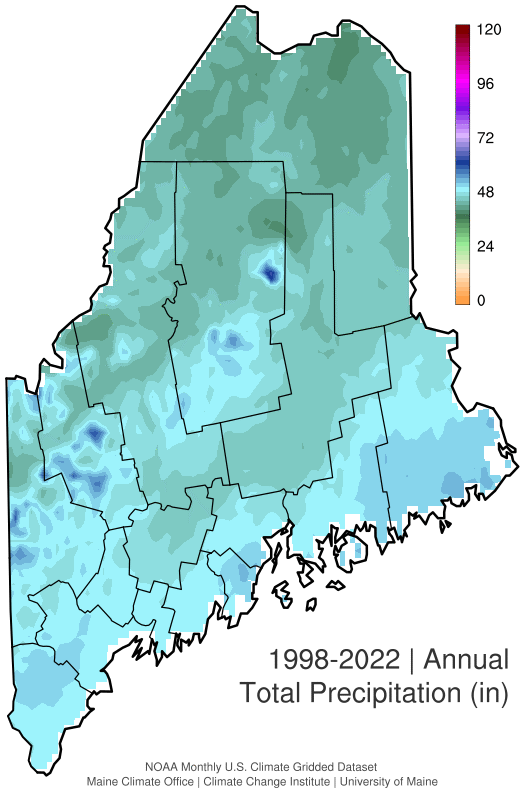
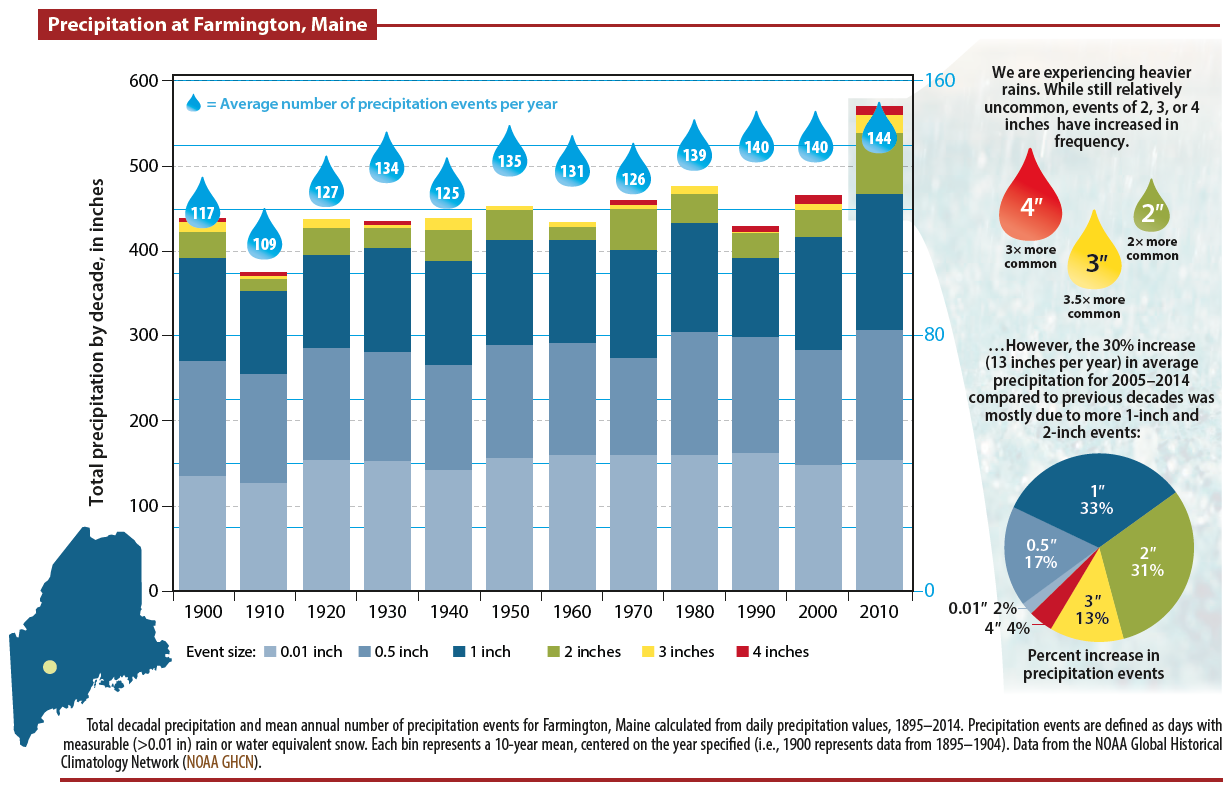
In conjunction with warming temperatures, the average amount of annual precipitation has increased by about 6 inches since 1895 (Fig. 3). More frequent heavy precipitation events, primarily in summer and fall, have also been observed since the late 1990s across the northeastern U.S. (Easterling et al. 2017; Huang et al. 2017; Howarth et al. 2019; Fernandez et al. 2020). Likewise, an analysis of daily precipitation measurements from Farmington, ME shows that for the decade centered on 2010 had the most number of 2 and 3-inch per day rainfall events for the record period beginning in 1900 (Fernandez et al. 2020) (Fig. 4). On average, 10 to 15 more heavy precipitation events occur per year compared to the previous century.
It is notable that after a historically wet decade (2005–2014), recent years have seen impactful drought (e.g., 2016 and 2020). The 2020 drought in particular stands out as in its occurrence May–September during the growing season, and USDA drought disaster declaration for Aroostook and adjoining counties in September of that year (Lombard et al. 2021; MCC 2021). However, despite this recent dryness, climate models project that annual precipitation will increase across Maine this century, particularly during winter and spring (Easterling et al. 2017). Warming temperatures are driving an enhanced hydrologic cycle, which in turn increases the potential for the development of extreme weather, including heavy precipitation events. However, it remains uncertain how this might affect drought frequency, as more rainfall could be offset by increased evaporation and near-surface soil moisture deficits caused by higher temperatures (e.g., Wehner et al. 2017; Hayhoe et al. 2007; MCC 2020).
Temperature Impacts Include: diminished winter season with less snowfall and shorter
period of ice cover on lakes and rivers; warming temperatures facilitate the northward spread of
invasive species and vector-borne diseases such as Lyme; agriculture may benefit from a longer
growing season and potential for new crop types, but warming temperatures lend to increased
evaporation and can exacerbate drought or dryness; warmer temperatures will lend to more high
heat index days and heat-related illness.
Precipitation Impacts Include: heavy precipitation events can produce excessive runoff,
creating potential for erosion and reduction in water quality; crop damage; flooding and damage
to civil infrastructure.
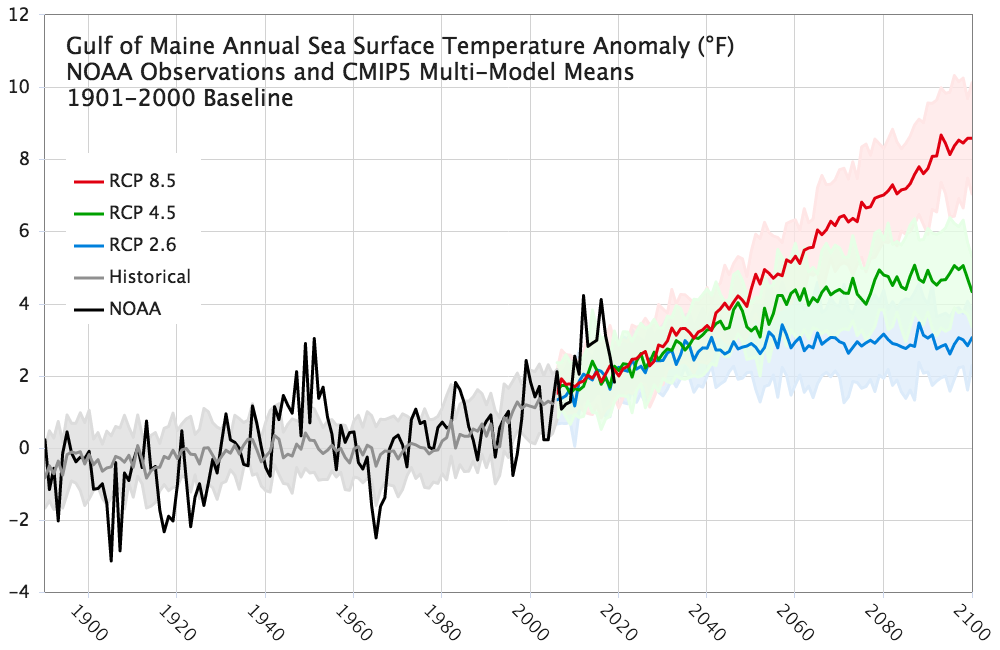
The Gulf of Maine (GOM) is among the most rapidly warming regions of the global ocean (Pershing et al. 2015), and as a result the marine ecosystem of the GOM is losing its subarctic characteristics (MCC 2020). This warming includes a series of marine heat waves, the first of which was observed in 2012 (e.g., Mills et al. 2013; Pershing et al. 2015; Bricknell et al. 2021). As in the terrestrial temperature climate, warming in the GOM is associated with an extension of summer-like temperatures on the order of 3–4 weeks in comparison to past decades (Thomas et al. 2017). Climate model projections indicate that the GOM’s mean annual sea-surface temperature could warm 1–3°F by 2050 and up to 1–7°F by 2100 depending on future greenhouse gas emissions worldwide (Fig. 5).
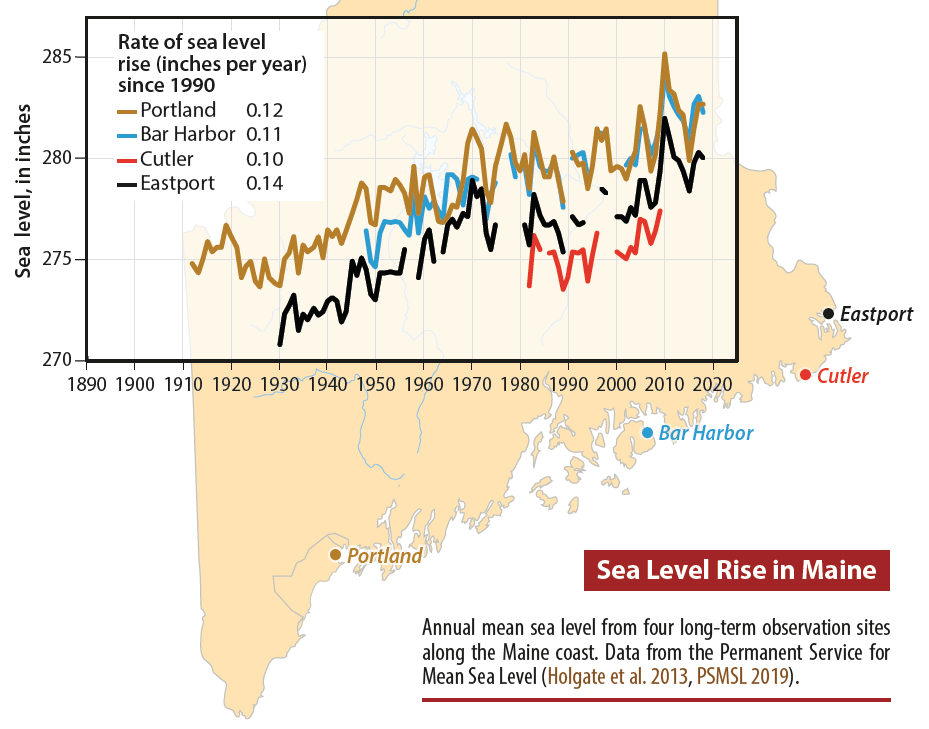
The longest record of sea level on the Maine coast is from a tide gauge in Portland, where since 1912 the annual water level has risen about 7.5 inches (Fernandez et al. 2020) (Fig. 6). About half of this sea-level rise has occurred since the early 1990s (MCC 2020). Sea level by the end of this century is projected to rise 3–5 feet based on an intermediate scenario of glacier melting and thermal expansion in the world oceans. In it’s 2020 climate assessment report, the Scientific and Technical Subcommittee (STS) recommends to the Maine Climate Council to commit to manage for 1.5 ft of sea level rise by 2050 and 3.9 ft by 2100. However, based on the largest uncertainties in sea-level rise projections, the STS also suggests preparing to manage for 3 ft of sea level rise by 2050 and 8.8 ft by 2100.
The STS highlights the following:
"A 1-foot increase in sea level in the future will lead to a 15-fold increase in the frequency of
'nuisance' flooding. Nuisance flooding in Portland in the last decade was about 4 times more
frequent than the 100-year average. A 1-foot increase in sea level, which could occur by 2050,
would cause a '100-year storm' flood level to have a probability of occurring once in every 10
years. Not accounting for changes in storm intensity or frequency, this would result in a 10-fold
increase in coastal flooding in Maine in the next 30 years."
Ocean Warming Impacts Include: loss of subarctic characteristics and significant changes
to the GOM marine ecosystem, fisheries, and aquaculture; increased species migration pressures;
increasing carbon dioxide concentrations in the atmosphere are causing ocean acidification, but
the current and future impacts in the GOM are unclear.
Sea Level Rise Impacts Include: increased coastal flooding and erosion, posing risk to
civil infrastructure; increased potential for saltwater intrusion of coastal drinking water
aquifers; coastal beaches, dunes, salt marshes, and bluffs may shift landward in response to
erosion.
The Maine Climate Office is overseen by the Maine State Climatologist, Dr. Sean Birkel, and supported by Cooperative Extension and the Climate Change Institute at the University of Maine. The MCO is a resource for climate and weather data, information, research, and educational outreach for Maine citizens.
Questions? Please send a note using this form.